
Edmund Pickering
Researcher, engineer, teacher
Where is the load applied in the mouse-tibia model? Insights through finite element modelling.
INTRODUCTION: The mouse-tibia loading model [1] has become the gold standard for investigating bone adaption and is a powerful tool in the exploration of interventions aimed at osteoporosis. In this, an in vivo loading regime is mechanically applied to the mouse tibia. Localised adaption of the cortical and trabecula bone can be measured. Often, this is replicated in silico through finite element modelling (FEM), providing deeper insights into the link between adaption and localised stresses and strain (a key component of Frost’s mechanostat [2]).
However, the FEM approach is problematic, as its predictions are highly dependent on how load is applied to the tibia. Differences in loading can results in large differences in the predictions of the FEM model. While some studies [3] have investigated this, the question of the where load is applied in the mouse-tibia model remains an open question. In this work, we seek to answer this question by investigating the relationship between load location and strain, comparing against experimental values.
METHODS: Female C57BL mice were used. Prior to experimentation, micro-CT slices were recorded. Following micro-CT, strain gauges were attached to the medial and lateral surface of the tibial diaphseal mid-shaft, proximal to the junction with the fibula, in line with the method used by De Souza [1]. The lower leg was mounted in a loading apparatus with the ankle and knee securely held by two cups. Loads were applied, up to 10 N, and the results strain gauge readings were recorded.
Using the micro-CT slices, the 3D geometry of the tibia was reconstructed through an in-house code. The volume was meshed through a direct voxel meshing approach where each voxel was transformed into an eight-node brick element. Nodes of the distal end were fixed. While the physiological loading at the proximal end is complex, it can be simplified to a single load at a representative location. A 10 N load was applied to the proximal end at selected coordinates. The load position was varied to quantify the relation between load location and strain measured at gauge locations. This is described in Figure 1a.
RESULTS AND DISCUSSION: The FEM modelling showed that the strains at each gauge location were highly dependent on the load location. This is significant as it demonstrates that failure to correctly identify the load location will results in erroneous prediction. To demonstrate this, Figure 1b-c shows the differing strain predictions for two different load locations.
This can be extended by modelling the gamut of potential load locations. In doing so, the effective load location can be ascertained, being the location with the minimum deviation between experimental and FEM strain values. This requires strain readings from a minimum of two gauges.
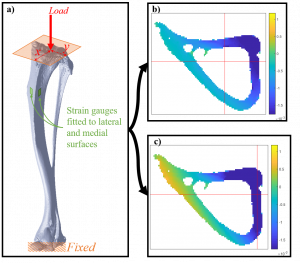
Figure 1: a) Schematic of the FEM model showing the variable load location, b-c) example strain predictions for two different load location (red cross-hair is a projection of the load location).
CONCLUSIONS: FEM modelling, coupled with in vivo data from two strain gauges can be used to determine the load location in the mouse-tibia loading model. Our results show that failure to correctly identify the load location will lead to erroneous results. We recommend that future works incorporate this technique to ensure valid predictions.
REFERENCES
- De Souza, R. L., et al, Bone, 37(6), 810–818.
- Frost, H. M, Anatomical Record – Part A Discoveries in Molecular, Cellular, and Evolutionary Biology, 275(2), 1081–1101.
- Poulet, B., et al., Arthritis and Rheumatism, 63(1), 137–147.
Leave a Reply